Journey tracking and visualisation
Journey tracking panel overview
- Each line represents a journey, and each column of the line is a step : the tag name is on the left, in bold, and it's tracking id is just below.
- The status of the step is represented by its color
> GREEN - the step is done
> BLUE - step is ongoing
> RED- step time has been exceeded and is still ongoing
Layout customisation
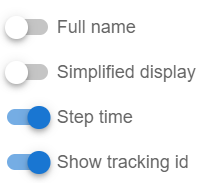
- Note that the layout can be customized with the  button located on the top right. This menu offers some UI options

- Show full name or only first letter of each word
- Simplified display is a full UI changes.
- Display or not the current step time, on the top right of the step rectangle
- Display tracking id in the left rectangle.
Related Articles
NAO Flow Overview
NAO Flow menu is a NAO Viewer sub menu that allow tag & journey association, dissociation and also journey tracking. Menu description Journey definition : this menu allows the management of journey definitions and journey step definitions. Map ...Journey definition
Journey index The journey creation menu can be see in NAOFLOW menu. This menu allows the user to manage the journey on his application. A journey is a sequence of steps, linked to a geofence. Journey form 1- First of all, you can create a journey by ...Tag asset dissociation
Tag - asset dissociation page This page allows to remove all the properties from a tag, and his associated journey. Process in depth More in depth, the process will : - remove one by one all of tag's properties - reset tag's name attributes to it's ...Tag asset association
The tag - asset association overview This panel allows to link a tag with a journey. It will create a link between the journey's step, the geofences and geonotification and the tag position. This page has some requirements in order to work. It ...Time seletor, filters, pre-filtering
Selecting a date To optimize the data visualisation, it is strongly recommended to select a time lapse. This will limit the data downloaded between the start and end date you choose. 1. To select a date, click on the time selector on top of the ...